
Let’s be honest - reporting is an admin task that most don’t enjoy. Even if you’re passionate about data, reporting always seems to be 10% data analysis and 90% working out how to reformat tables and graphs so that they’re appealing to the end user.
At Cedarwood Digital, we’ve had our fair share of reporting trials. As an agency with a double-figure client base, we tried creating Excel sheets for each client using Google Sheets - a painstaking administration process that, although clients liked, was far too laborious from an agency side. Then there were the PDF report generators, which were popular from an agency perspective thanks to their automation, but were hated amongst clients due to their confusing interface and rigid format that offered little customisation.
Cue Google’s Data Studio, a free tool that promises to pull in data from your Google Suite to streamline reporting. In October 2018, the tool came out of beta and was available for eager marketers to trial. Within two months, Google’s Data Studio had cut our reporting time by 50%, thanks to dashboard-style interfaces that are populated with live feeds. We quickly switched all our reporting to the platform and here’s why you should too.
1. It’s free
Whilst small businesses can often get put off from investing in reporting tools with inflated prices, Google’s Data Studio is completely free, regardless of whether you use a free Google account or subscribe to GSuite. Data Studio is part of Google’s family of products, so you can keep your logins the same and easily switch from your Google Analytics account to access Data Studio.
Of course, there is the option to upgrade, but this isn’t essential - our agency manages fine with the free version. But you can upgrade if you want to input external data or use 3rd party data connectors to make your external data connection seamless.
2. There’s no manual data entry
Zilch. Data Studio connects seamlessly with Google Analytics, Google Ads and Search Console, allowing you to visualize data from a variety of sources at the click of a button. All metrics and dimensions, like sessions, users and location, are pre-formatted and recognized as either a metric or a dimension, allowing for easy filtering.
Also, the system automatically identifies which metric is being used, whether its time, location or count, so there’s no need to specify this. Data can also be pulled from third parties including Facebook, however some third parties syndication requires an upgraded account.
3. Dashboards are relatively easy to set up
As with Google Analytics, dashboards can be created in Data Studio to slice data and quickly offer a top-line analysis of key trends. Making this type of report is intuitive thanks to a simple drag and drop interface - simply find the metric you need in the list and drag and drop it to the chart element where you want it to be displayed.
This allows the user to move away from rigid reporting and instead customize reports to tell a story with data. For example, we created dashboards that showed an overview of traffic sources to determine how each traffic source is converting, before drilling down into each channel to offer in-depth analysis of filters such as assisted conversions, revenue by location and brand vs non-brand search queries.
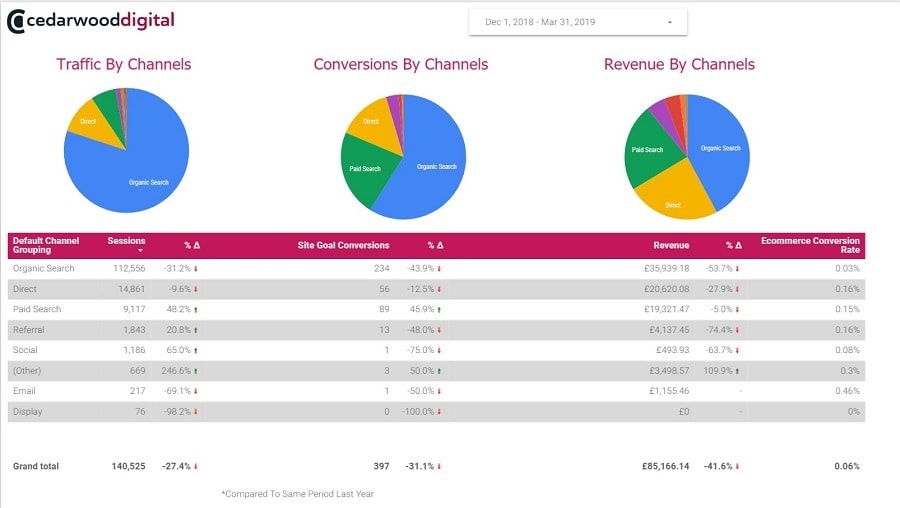
Here's a quick glance at how Google Data Studio's dashboard looks.
4. Reports display live data
Because Data Studio uses a live data feed, reports display real-time results. We send out reports to clients monthly, so the data range selection tool is defaulted to monthly, however clients will often change the data selection to previous weeks and months for their own comparisons. Clients love this interactive element of the report, as it allows them to have better control and oversight of their investment in digital marketing.
5. There are some functional limitations, but overall the platform delivers quality, free reporting
As with integrating any tool, we hit some bumps along the road due to functional limitations. For example, we couldn't display Multi-Channel Funnel data to show the much needed Assisted Conversion report. However, we found a way around this by importing data through Google sheets - which isn’t the most user-friendly format, but it did the job. Supermetrics data connector is also a great tool for those who want to cut the admin time of generating spreadsheets - it can pull an extensive list of additional metrics from Google Analytics.
However, despite these small limitations, Data Studio overall offers great functionality and accessible reporting for literally no cost. And for report handlers who are questioning whether established and costly data analysis tools like Tableau or Power BI are worth it, it’s easy to argue in Google Data Studio’s favour.
6. Data analysis is a lot easier
Many marketers use the Google Analytics interface to investigate dips in traffic, data anomalies or trends. However, simple analysis like this is much easier to do in Data Studio thanks to attractive visual data. Simply add extra metrics or slice data by additional dimensions by selecting metrics from the site’s suggested list. Having clearer data segmentation and aesthetically pleasing displays makes data insights discovery more exciting.
7. It’s easy to share with clients and stakeholders
Simply share a link to the Data Studio report, much like you would for a Google Document, and the client or stakeholder can open it to access the report. The link always remains the same, so clients can bookmark the link so that they have constant access to the data they need. A new PDF option has also been recently released by Google which allows users to schedule exports of PDFs to specific email addresses, so you can automate report delivery.
8. You spend less time creating reports and more time where it matters
The best thing about Google Data Studio, in my opinion, is the fact that you only need to generate report templates once. For example, once you’ve set up a report for your website’s performance, Data Studio will continuously populate the report with the live feed, so there’s no need to cut and paste data each month come report deadline day. This means there’s much less time spent on reporting, allowing for more time to be spent dealing with creative campaigns and client briefs. Data Studio’s reports are more like dashboards that highlight interesting data to viewers and our reporting process now focuses on interpreting the data to pull out important points for our clients.
As with any Google product, Data Studio may feel overwhelming at the beginning. However, it is intuitive and once you’ve got your head around the interface, it’s really very easy to use. Reporting doesn’t have to be time-consuming or boring, it can actually be very simple.
About the Author
Edgars Boitmanis is a marketing and data analyst at Cedarwood Digital, a digital marketing agency based in Manchester. Edgars ensures that businesses maximize their data and use data-driven strategies to enhance their marketing campaigns.
If you enjoyed this article, you can learn how to produce essential digital marketing reports in Google Data Studio with Edgars Boitmanis’ Udemy course. Click here to view the course and use discount code ‘FLEXIMIZE’ for 50% off.

These cookies are set by a range of social media services that we have added to the site to enable you to share our content with your friends and networks. They are capable of tracking your browser across other sites and building up a profile of your interests. This may impact the content and messages you see on other websites you visit.
If you do not allow these cookies you may not be able to use or see these sharing tools.